Highland Beach Housing Market Data
159
# Active Properties
10.42% Increase
32
# New Properties
10.34% Increase
15
# Sold Properties
15.38% Increase
$817
Avg. Asking Price/Sq.Ft.
11.83% Decrease
$772
Avg. Sale Price/Sq.Ft.
6.08% Decrease
$2.73M
Avg. Sale Price
10.91% Decrease
128.12
Avg. DOM - Active Properties
2.20% Decrease
112.6
Avg. DOM - Sold Properties
14.05% Decrease
Increase/Decrease activity is compared to the month of October
In case of no data for this period, the latest 30-day average is used. Subscribe to Market Insights
$2,241,521
Average calculated by selected date range
Avg. List Price - Active Properties
There was a 16.9% increase in the selected date range
$1,707,599
Average calculated by selected date range
Avg. Sale Price
There was a 166.0% increase in the selected date range
166
Average calculated by selected date range
# Active Properties
There was a 0.0% increase in the selected date range
12
Average calculated by selected date range
# Price Changes
There was a 1000.0% increase in the selected date range
92.7%
Average calculated by selected date range
Avg. Sale Price (% of Asking)
There was a 2.3% increase in the selected date range
$780
Average calculated by selected date range
Avg. Asking Price/Sq.Ft.
There was a 19.3% increase in the selected date range
$678
Average calculated by selected date range
Avg. Sale Price/Sq.Ft.
There was a 39.8% increase in the selected date range
17
Average calculated by selected date range
# Sold Properties
There was a 0.0% increase in the selected date range
23
Average calculated by selected date range
# New Properties
There was a 0.0% increase in the selected date range
128
Average calculated by selected date range
Avg. DOM - Sold Properties
There was a 19.1% increase in the selected date range
Sold Properties in Highland Beach
$1,710,000
closed
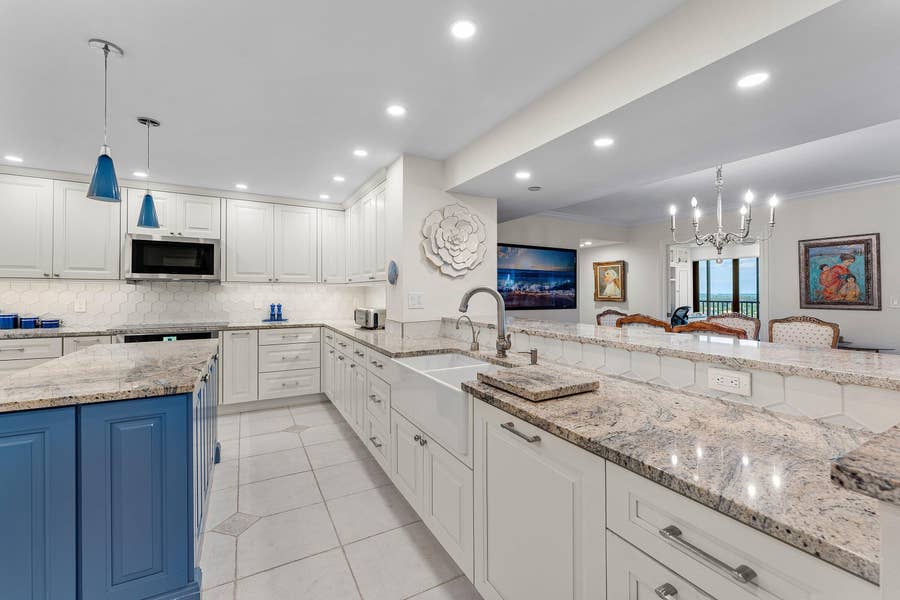
3420 S Ocean Boulevard, #PH-W
Highland Beach, FL 33487
3 Bed
3 Baths
2,178 sq ft

$540,000
closed
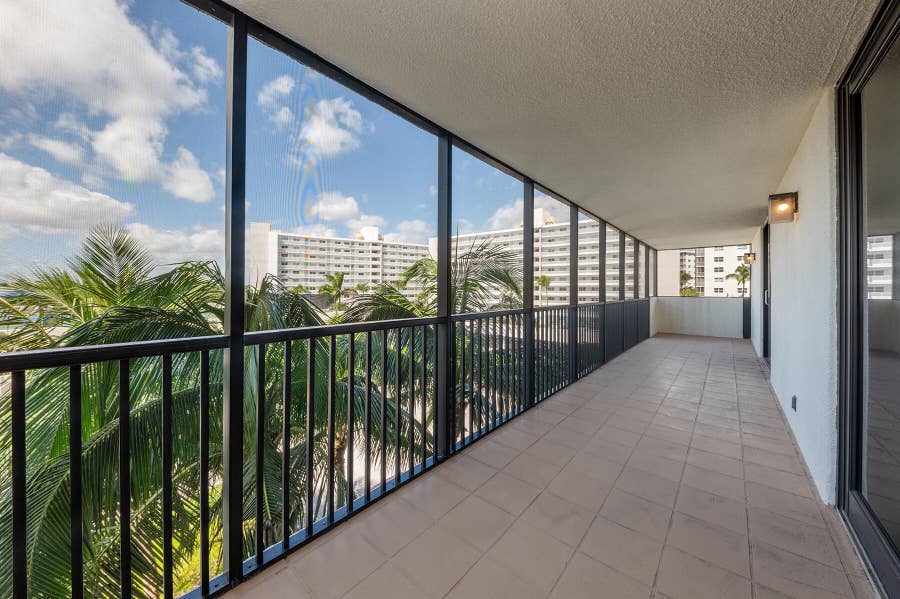
3400 S Ocean Boulevard, #4h
Highland Beach, FL 33487
2 Bed
2 Baths
1,449 sq ft
$432,000
closed
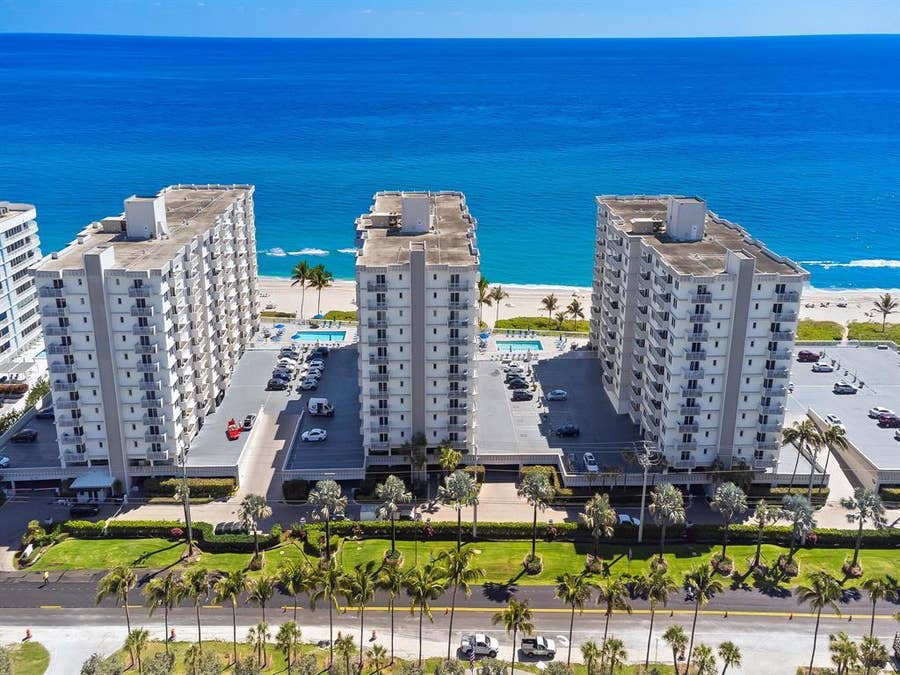
3215 S Ocean Boulevard, #906
Highland Beach, FL 33487
2 Bed
2 Baths
1,050 sq ft
$1,955,000
closed
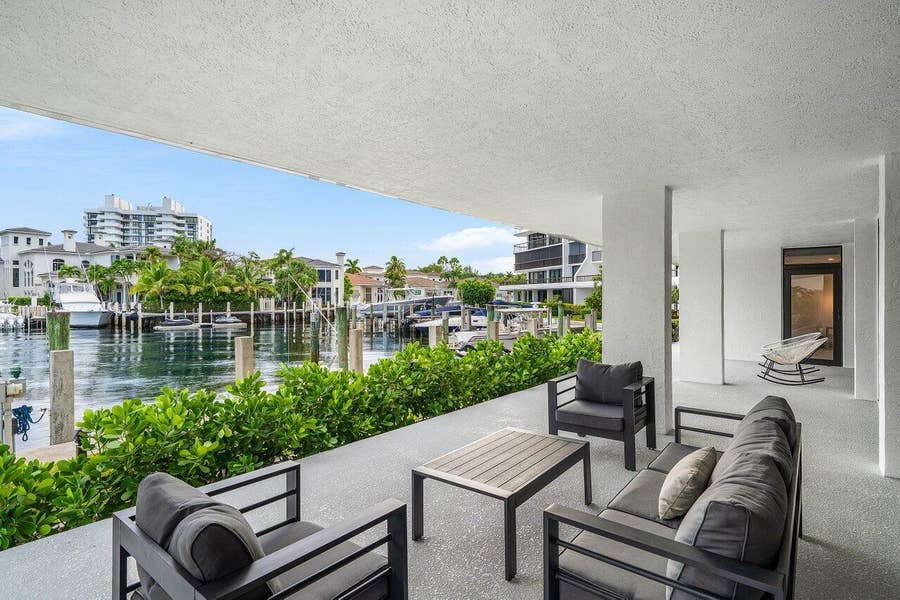
4740 S Ocean Boulevard, #105
Highland Beach, FL 33487
3 Bed
3 Baths
2,100 sq ft
$515,000
closed
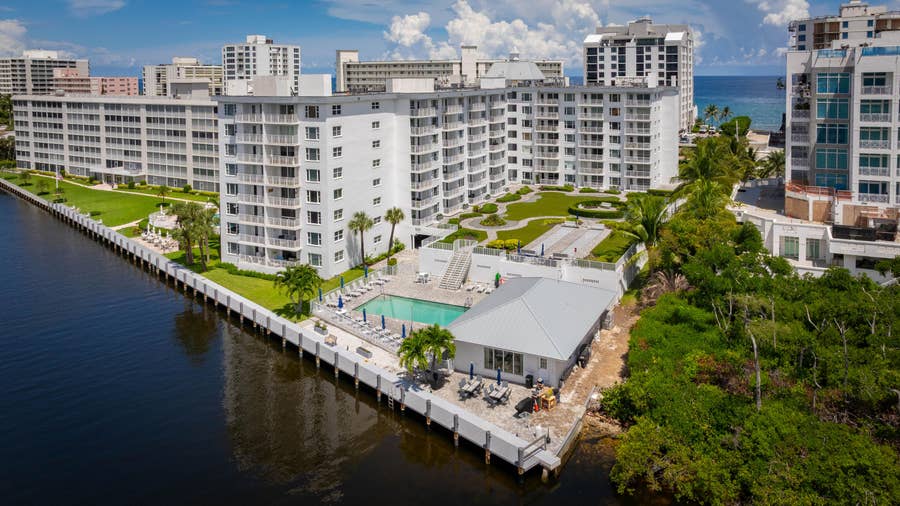
3114 S Ocean Boulevard, #509
Highland Beach, FL 33487
2 Bed
2 Baths
1,102 sq ft
$425,000
closed
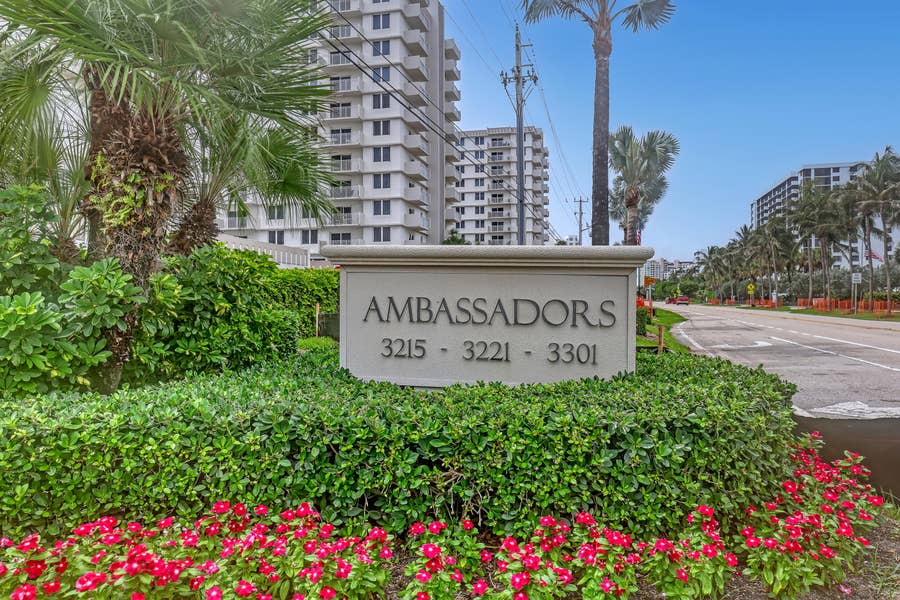
3221 S OCEAN Boulevard, #302
Highland Beach, FL 33487
2 Bed
2 Baths
1,050 sq ft
$26,000,000
closed
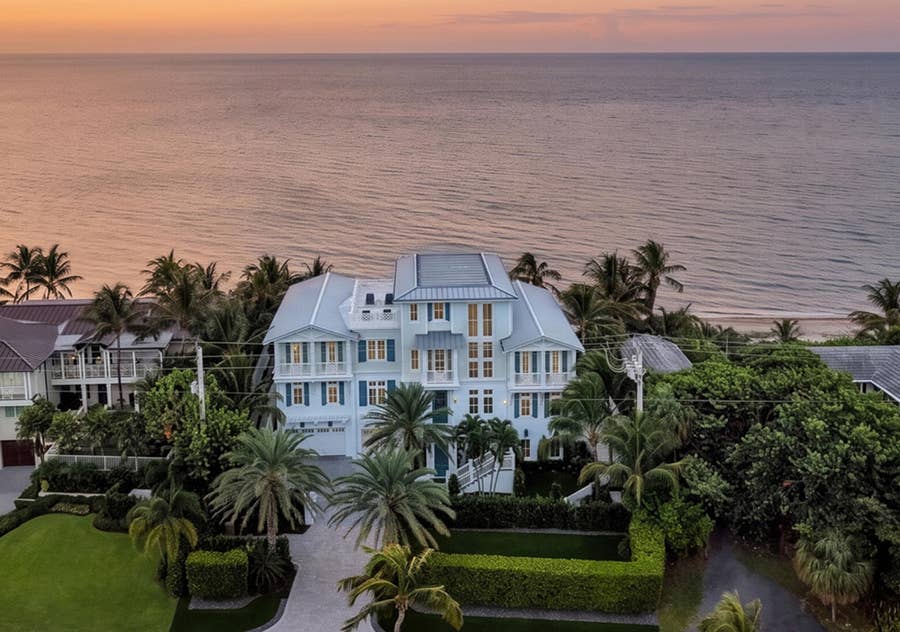
4101 S Ocean Boulevard
Highland Beach, FL 33487
7 Bed
8 Baths
8,111 sq ft
$525,000
closed
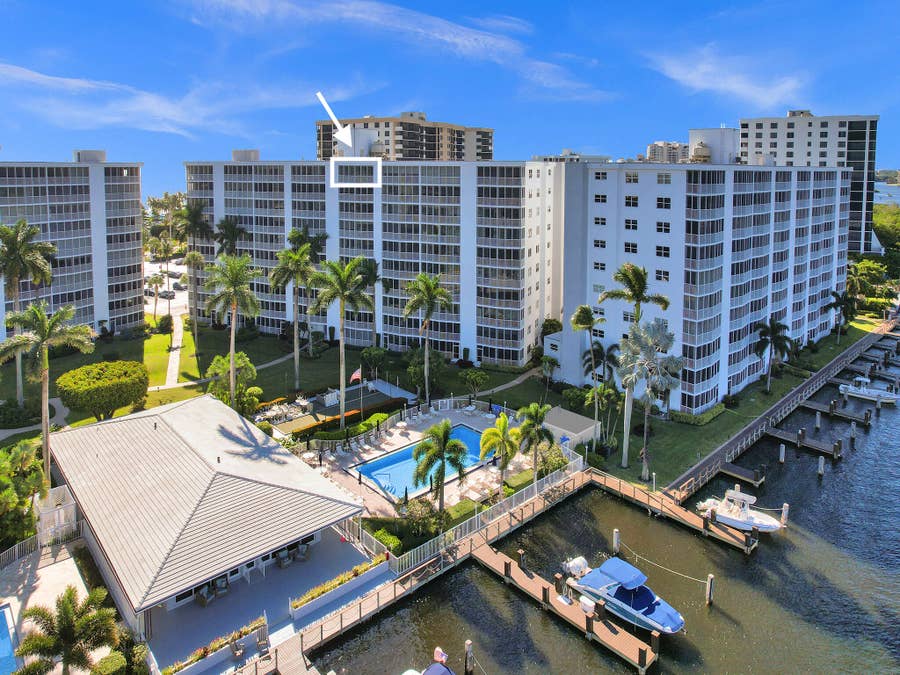
3300 S OCEAN Boulevard, #1021-C
Highland Beach, FL 33487
2 Bed
2 Baths
1,201 sq ft
$680,000
closed
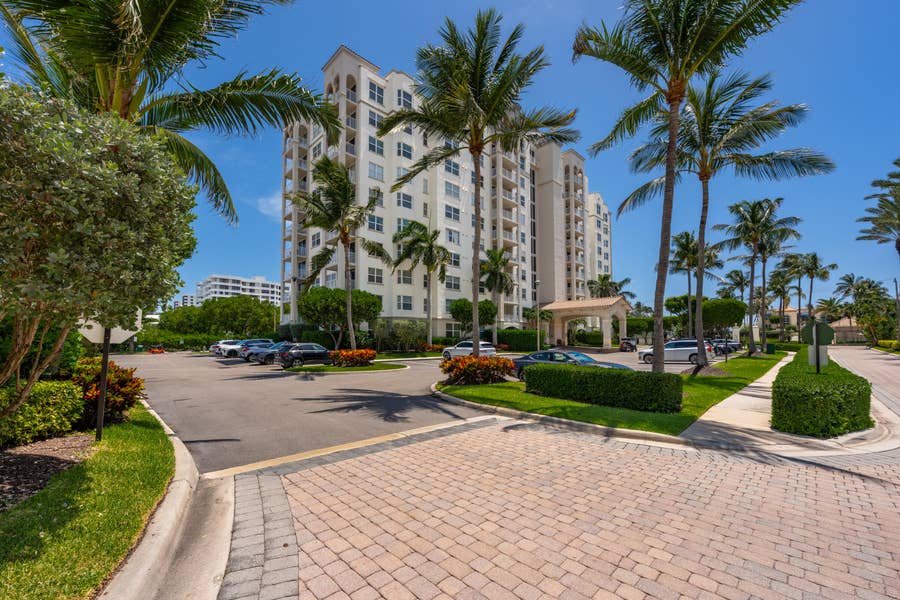
3594 S Ocean Boulevard, #604
Highland Beach, FL 33487
2 Bed
2 Baths
1,400 sq ft
$1,375,000
closed
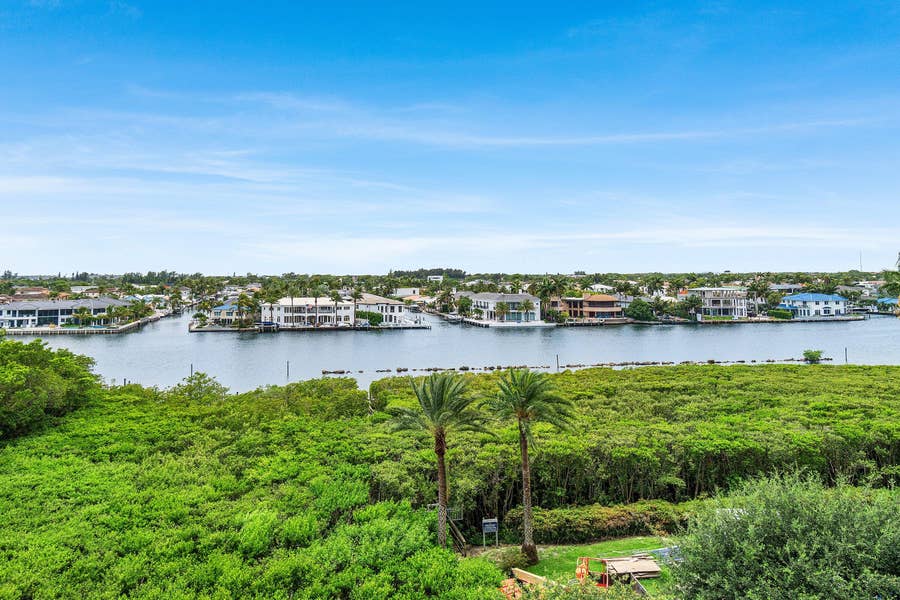
3720 S Ocean Boulevard, #502
Highland Beach, FL 33487
2 Bed
3 Baths
2,292 sq ft
$1,950,000
closed
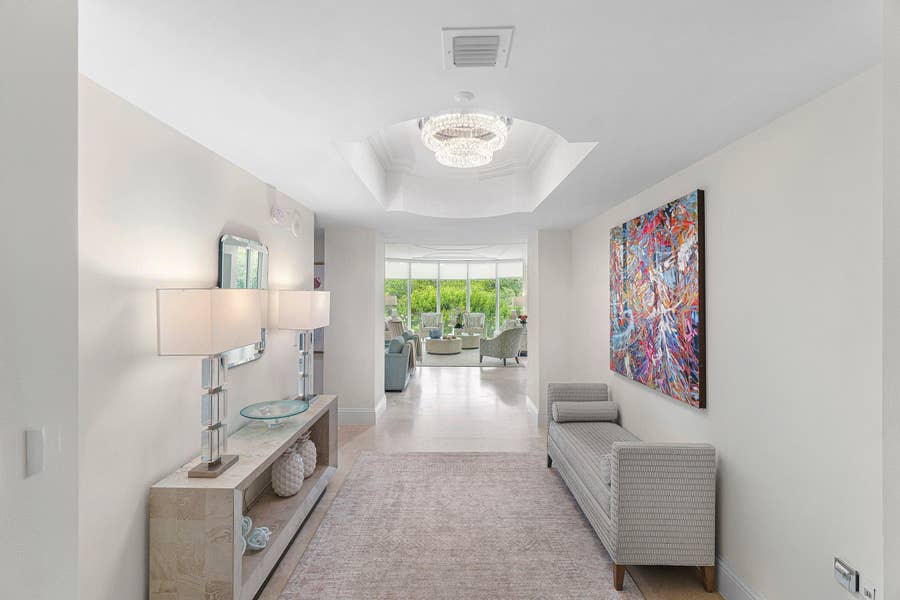
3720 S Ocean Boulevard, #208
Highland Beach, FL 33487
3 Bed
4 Baths
3,093 sq ft
$1,150,000
closed
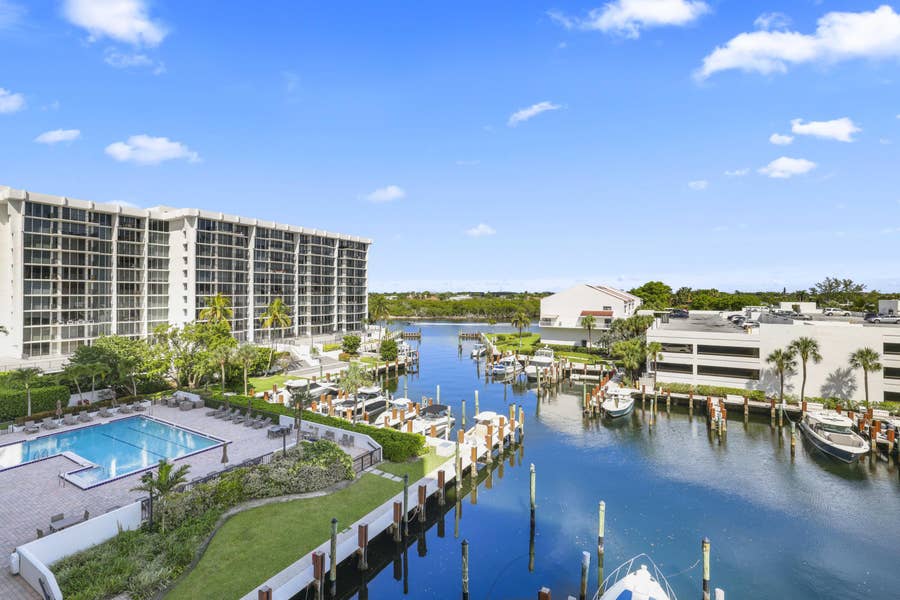
4748 S Ocean Boulevard, #502
Highland Beach, FL 33487
2 Bed
2 Baths
1,426 sq ft
Active Properties in Highland Beach
$1,175,000
on market
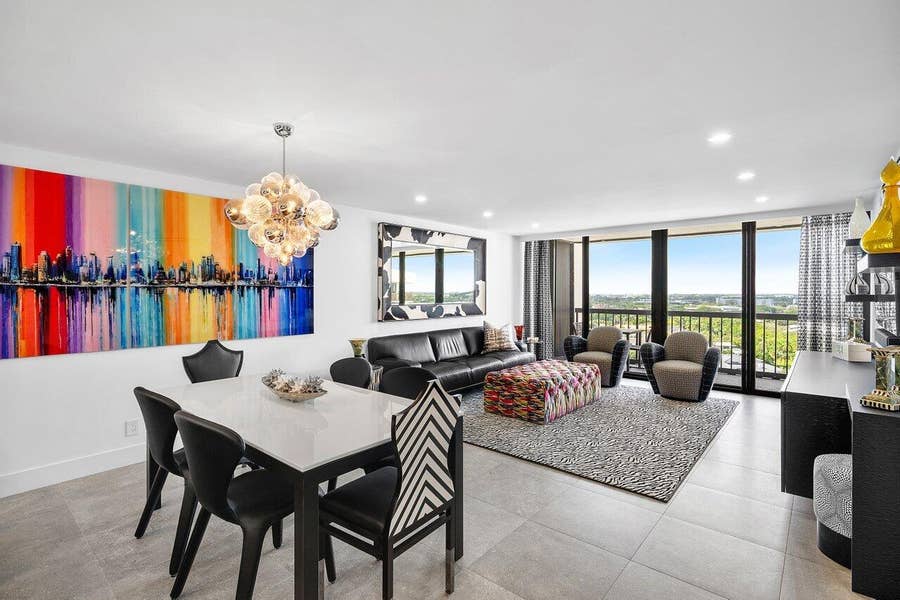
4740 S OCEAN Boulevard, #1709
Highland Beach, FL 33487
2 Bed
2 Baths
1,500 sq ft
$849,000
on market
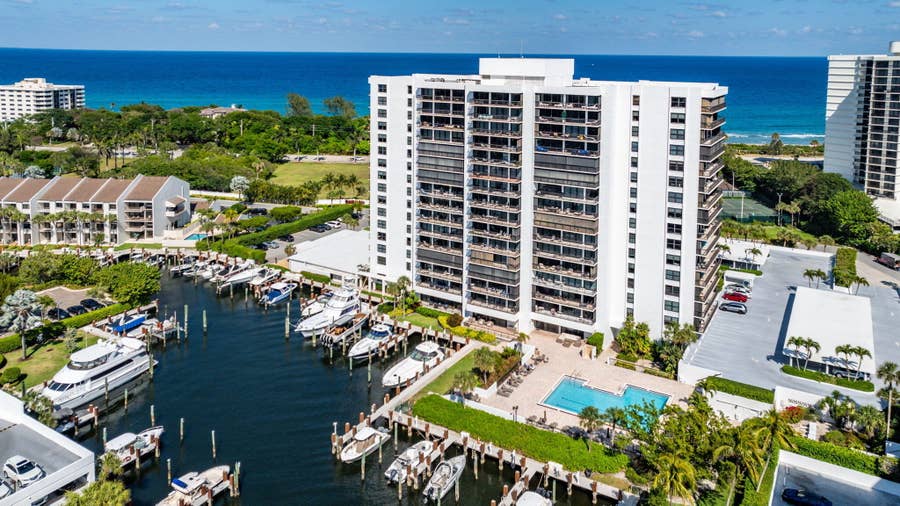
4748 S OCEAN Boulevard, #301
Highland Beach, FL 33487
2 Bed
2 Baths
1,426 sq ft
$750,000
on market
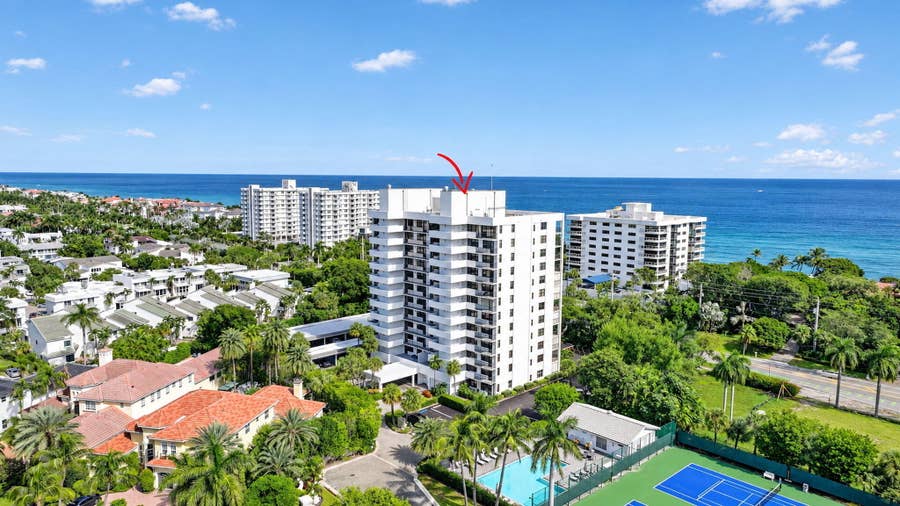
4600 S Ocean Boulevard, #502
Highland Beach, FL 33487
2 Bed
2 Baths
1,556 sq ft
$5,000,000
on market
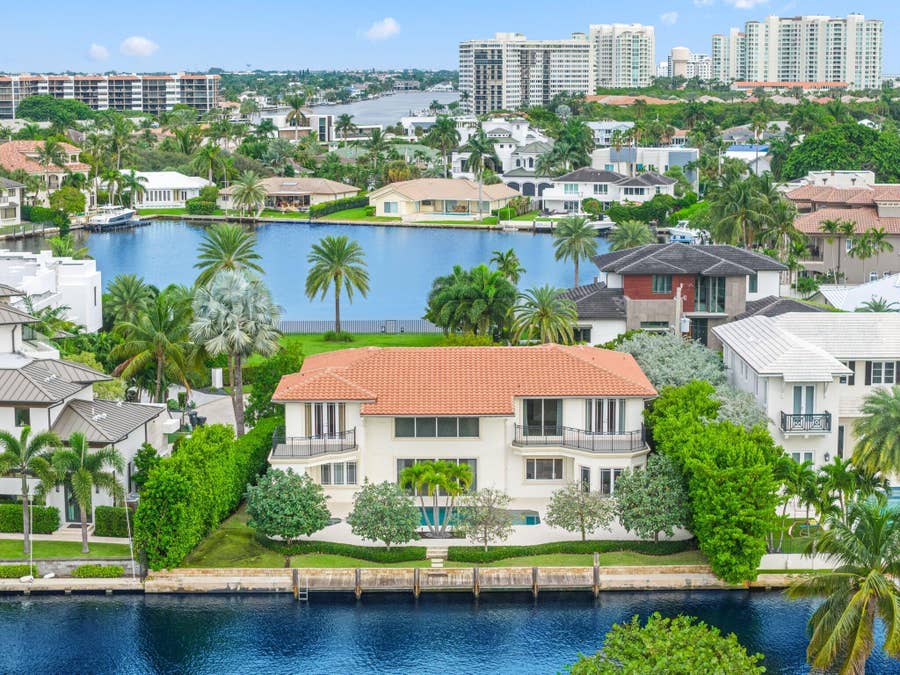
4420 Tranquility Drive
Highland Beach, FL 33487
5 Bed
4 Baths
4,064 sq ft
$949,000
on market
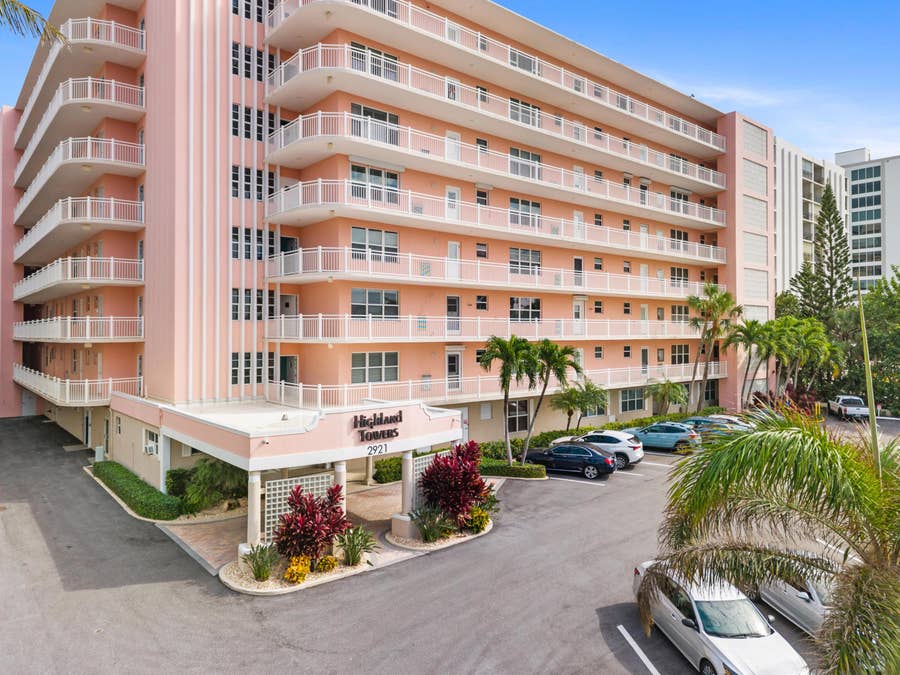
2921 S Ocean Boulevard, #501
Highland Beach, FL 33487
2 Bed
2 Baths
1,330 sq ft
$929,000
coming soon
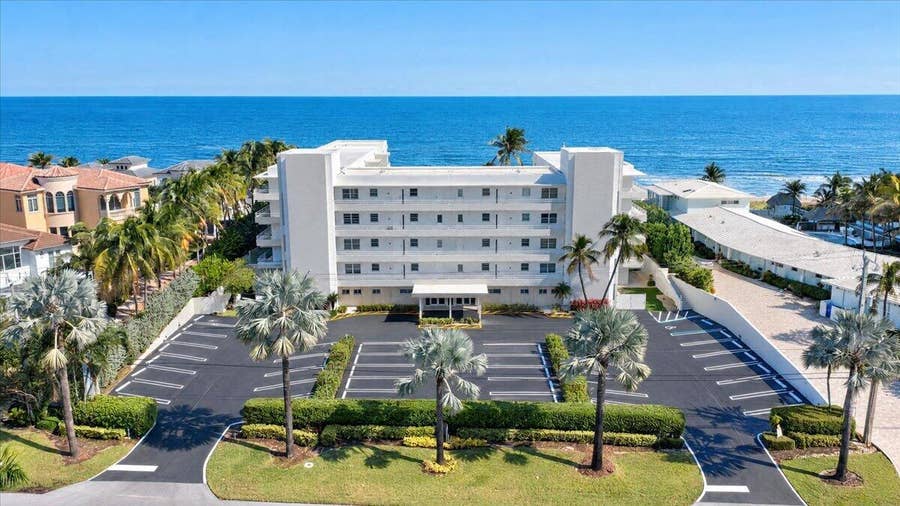
2701 S Ocean Boulevard, #15
Highland Beach, FL 33487
2 Bed
2 Baths
1,344 sq ft
$1,100,000
on market
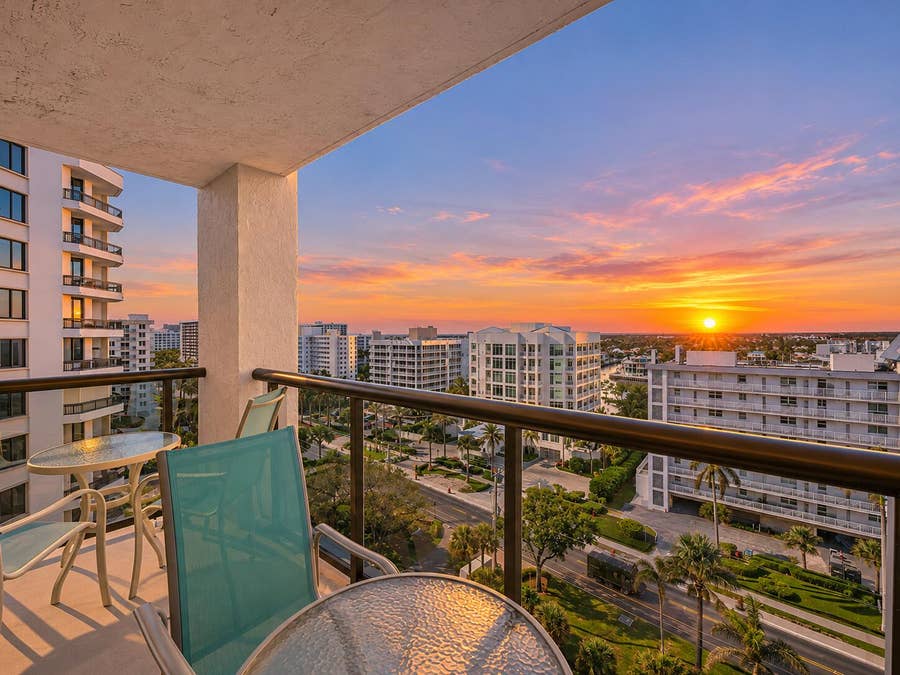
3115 S Ocean Boulevard, #901
Highland Beach, FL 33487
3 Bed
3 Baths
1,852 sq ft
$1,200,000
on market
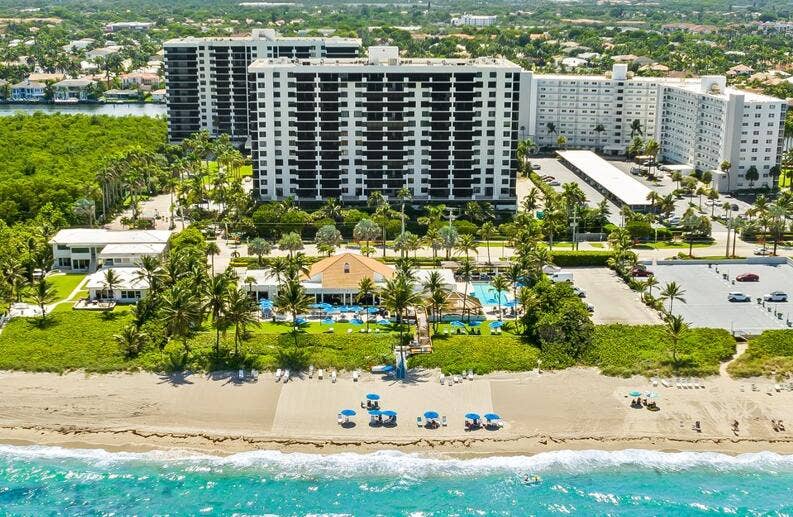
3400 S OCEAN Boulevard, #15M
Highland Beach, FL 33487
2 Bed
2 Baths
1,449 sq ft
$1,850,000
on market
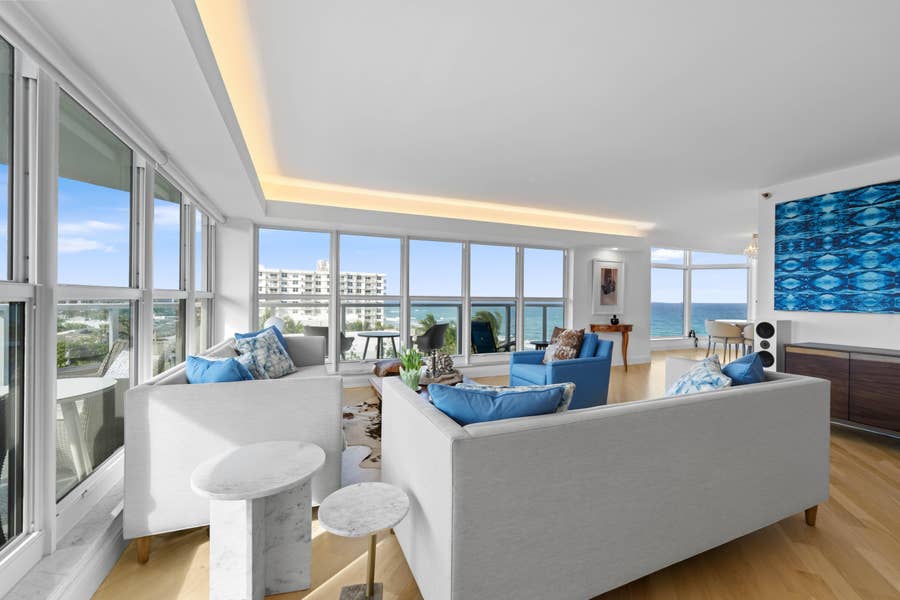
4605 S OCEAN Boulevard, #7C
Highland Beach, FL 33487
3 Bed
3 Baths
2,600 sq ft
$800,000
on market
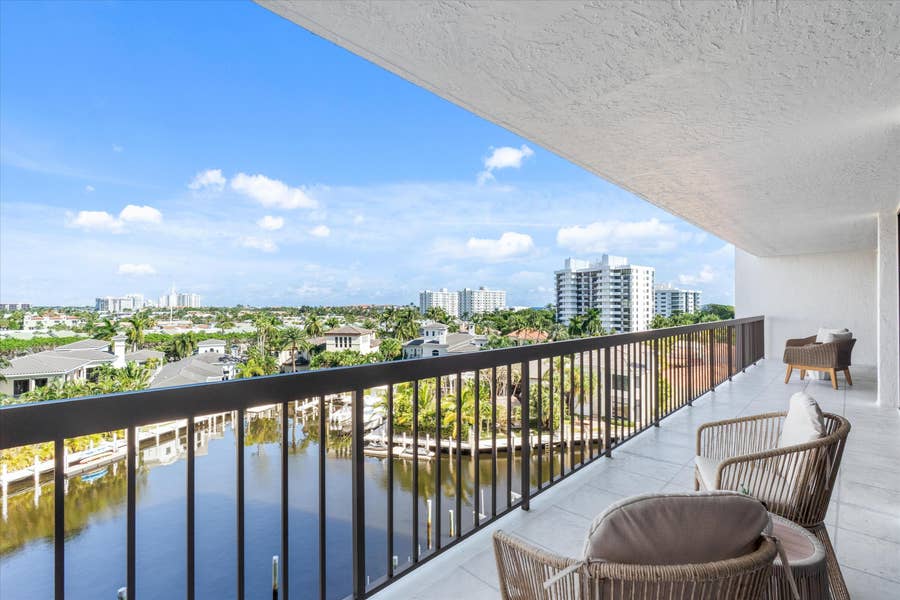
4740 S OCEAN Boulevard, #702
Highland Beach, FL 33487
2 Bed
2 Baths
1,500 sq ft
$3,250,000
on market
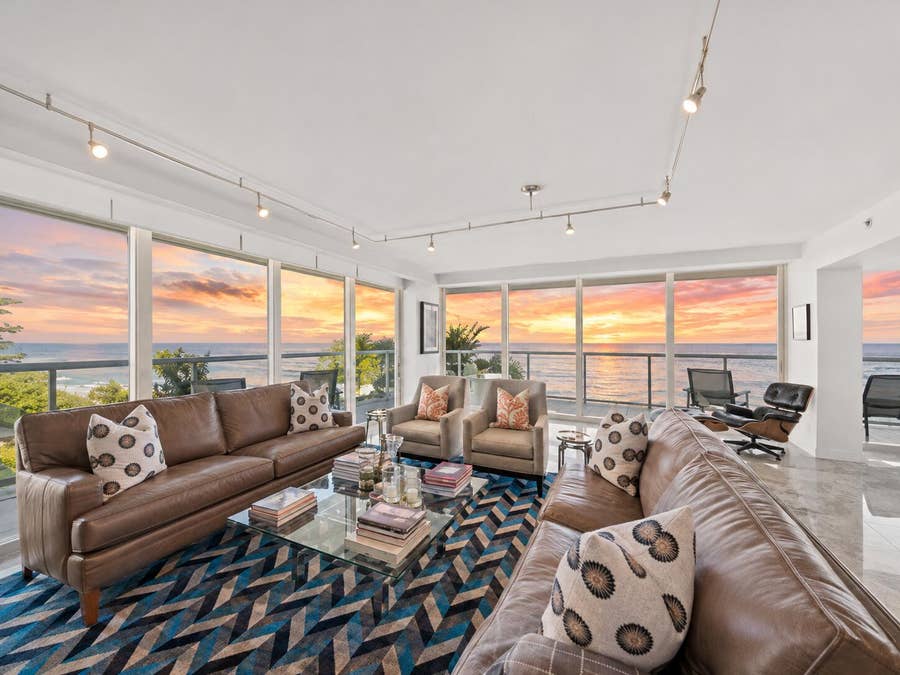
3505 S Ocean Boulevard, #5n
Highland Beach, FL 33487
2 Bed
3 Baths
2,659 sq ft
$799,000
on market
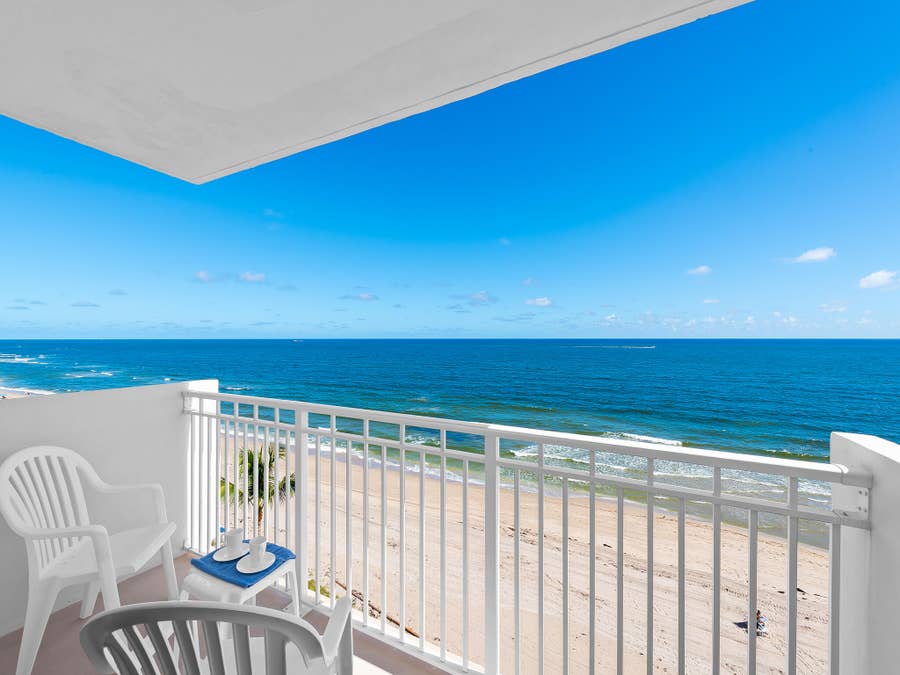
3215 S Ocean Boulevard, #612
Highland Beach, FL 33487
2 Bed
2 Baths
1,050 sq ft
All listings featuring the BMLS logo are provided by BeachesMLS Inc. This information is not verified for authenticity or accuracy and is not guaranteed. © 2026 BeachesMLS, Inc. All rights reserved.
BeachesMLS data last updated on November 18, 2026 09:29 AM - ET
Copyright 2026 MIAMI REALTORS® MLS. IDX information is provided exclusively for consumers' personal, non-commercial use, that it may not be used for any purpose other than to identify prospective properties consumers may be interested in purchasing, and that data is deemed reliable but is not guaranteed accurate by the MLS.
MIAMI REALTORS® MLS data last updated on November 18, 2026 09:32 AM - ET
